PropertyGuru Singapore Property Price Index Q3 2019 gives the full rundown on real estate trends
Dishing out mega-projects such as Avenue South Residence and Parc Clematis, the larger developers made their move in the 3rd quarter of 2019 as buyers showed signs of returning to the market.
PropertyGuru Singapore Property Price Index quarterly report gives the full picture.
Table of Contents
Buying a home is one of the most difficult decisions of our lives. It is also likely to be the most expensive decision. When committing to a home purchase, it is important to be equipped with relevant and sufficient information so that the decision can be made confidently.
PropertyGuru said it wants to simplify this process for property seekers, including first-time homebuyers and existing homeowners who might be looking into buying their second or third properties. In that vein, PropertyGuru created this report to help Singaporeans understand the movement of the property market better, so that property buyers can gain greater insight on current price trends that are in line with market sentiments, and to try to time their property purchases better.
As a leader in the real estate market in Singapore, PropertyGuru processes a vast amount of real estate data daily, providing us with the necessary data to crunch, and deliver in-depth insights to all Singaporean home seekers.
In this PropertyGuru Singapore Property Price Index quarterly report, the real estate services company looks at pricing and supply indices of private residential properties in Singapore, in various locations, and across different property types, to provide a comprehensive overview of property market dynamics across the city-state.
Using a range of statistical techniques, the data from over 200,000 private home listings on PropertyGuru Singapore are aggregated and indexed, demonstrating the movement of supply-side pricing. The PropertyGuru Property Price Index shows seller optimism and indicates the price level that developers and homeowners feel that they can fetch for their respective properties.
PropertyGuru said an increase in the Index may demonstrate buoyancy of sentiment while a decrease may indicate a moderation of expectations. The Index is based on price levels as of Q1 2015. This means that aggregated price levels are denominated as 100 at Q1 2015, and the subsequent quarters’ pricing are relative to that.
PropertyGuru complements the price levels with a view on supply volumes in the market through the number of property listings on PropertyGuru Singapore. Its supply volumes not only take into account residential resale supply, but also new launch supply in Singapore.
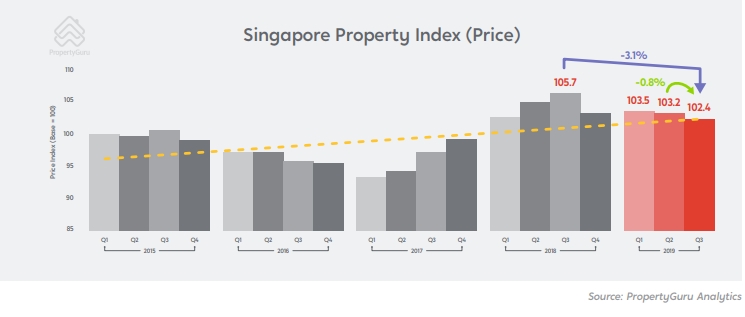
In Q3 2019, the PropertyGuru Singapore Property Price Index (SPPI), which focuses on the asking prices in the non-landed private residential market, fell by 0.8% to 102.4 in the previous quarter. This marks a steady decline since the start of 2019, and a fall of 3.1% year-on-year since the highs of Q3 2018, when the Singapore government’s additional cooling measures came into effect. The tapering of the SPPI likely points to an increasing number of sellers entering the market and moderating their expectations to secure buyers
Meanwhile, The PropertyGuru Singapore Property Supply Index (SPSI), which focuses on the number of non-landed private residential listings posted on PropertyGuru, saw a gain of 14.9% from 94.5 in the previous quarter to 109.2 in Q3 2019. This marks the biggest increase in the SPSI in more than a year. In total, 20 postal districts reported an increase in the number of listing postings which, when viewed in perspective with the increased transaction volume in Q3 2019 that saw 5,763 total units transacted, could indicate a significant reboot in market activity—on both the buying and selling fronts—since the implementation of additional property curbs last July.
Key Highlights Of The Property Market Report Q3 2019
- For the second successive quarter, asking prices in the non-landed private residential market continued to taper slightly downwards as the number of listings increased, which likely point to an increasing number of sellers entering the market and moderating their expectations to secure buyers
- Large and mega-scale newly launched private residential projects proved popular with buyers in the quarter, with five of the top 10 best-selling condominiums located in Districts 3 and 5
- After seeing a significant increase in asking prices from the previous quarter and year-on-year respectively, District 7 looks set to become the most expensive residential district in Singapore, taking into account three new and upcoming projects in the Bugis precinct
Considering both the PropertyGuru Singapore Property Price Index and the URA statistics for Q3 2019, it could be inferred that sellers have been revising their asking prices to make it more palatable to buyers, whereas buyers are increasingly willing to pay more, creating a situation where sellers and buyers are meeting halfway, in contrast to the wait-and-see mentality both sides have adopted in the first half of 2019. PropertyGuru said this ‘meeting halfway’ phenomenon can be seen in the new launch market for condominiums.
The 327-unit Daintree Residence, the first project to be launched after the 8 July 2018 cooling measures were announced, have seen its prices inch downwards over the past year, from an average psf transaction price of $1,700 in Q3 2018 to $1,599 in Q3 2019—a decrease of nearly 6%.
The reported noted that Q3 2019 was the best quarter for Daintree Residences in terms of sales volume—13 units transacted—since Q3 2018 (when it sold 41 units in that quarter). In between, just 14 units were sold in 9 months. The report said that it would appear that, in the case of Daintree Residences, developer SP Setia and prospective buyers may have ‘settled’ on a pricing that stimulates take-up—a classic case of property economics at work.
The report analysed that the buyer-seller common ground is an argument supported by the high take-up of new launch condo units in Q3 2019, with the 3,281 units sold—the highest since Q2 2013. This is a significant 39.6% jump from Q2 2019 (2,350 units sold) and an 8.9% increase from Q3 2018 (3,012 units sold).
In contrast, the volume of private residential resale transactions in Q3 2019 grew quarter-on-quarter by 0.3%, from 2,371 to 2,378 units, and fell 11.0% year-on-year from 2,672 units in Q3 2018.
“Although the cooling measures have dampened private home prices, it is likely that second-property buyers have begun to price-in ABSD (Additional Buyer’s Stamp Buyers and sellers ‘meeting halfway’ Duty) into their total outlay, taking away its psychological impact,” remarked Mr Tan Tee Khoon, PropertyGuru’s country manager for Singapore.
“Those who may have delayed entering the market last year could be starting to enter now, with new launches being favoured due to lower quantum entry prices and the progressive payment scheme.”