In Q4 2019, the decline in URA’s Office Rental Index for the Central Region accelerated to 3.2% QOQ, after falling 0.6% in Q3 2019, bringing the full year 2019 office rents decline in the Central Region to 3.1%
Office market decreased by 0.5% in 4th Quarter 2019, compared with the 3.9% decrease in the previous quarter said URA in its release of its latest statistics.
Prices and Rental in the Office Market
Table of Contents
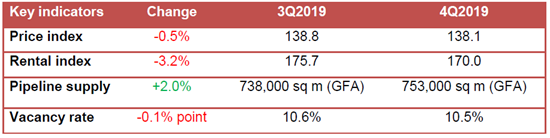
Rentals of office space decreased by 3.2% in 4th Quarter 2019, compared with the 0.6% decrease in the previous quarter. For the whole of 2019, prices of office space decreased by 0.6%, compared with the increase of 5.7% in 2018; while rentals of office space decreased by 3.1%, compared with the increase of 7.4% in 2018.
Supply in the Pipeline in the Office Market
As at the end of 4th Quarter 2019, there was a total supply of about 753,000 sq m GFA of office space in the pipeline, compared with the 738,000 sq m GFA of office space in the pipeline in the previous quarter.
Stock and Vacancy in the Office Market
The amount of occupied office space increased by 30,000 sq m (nett) in 4th Quarter 2019, compared with the increase of 71,000 sq m (nett) in the previous quarter. The stock of office space increased by 29,000 sq m (nett) in 4th Quarter 2019, compared with the decrease of 4,000 sq m (nett) in the previous quarter. As a result, the island-wide vacancy rate of office space declined to 10.5% as at the end of 4th Quarter 2019, from 10.6% as at the end of the previous quarter.
Commenting on the full year 2019 office rents decline in the Central Region to 3.1%, Colliers International noted:
“Price declines were more subdued, with the URA’s Office Price Index for the Central Region declining by 0.5% QOQ in Q4 2019, slowing down from the sharp 3.9% decrease in Q3 2019. In 2019, office prices in the Central Region fell 0.6%, compared with the increase of 5.7% in 2018.
Overall, 2019 had been a strong year for investment sales in office or mixed office developments, rising 62% YOY to SGD7.6 billion on heightened investor interest. Over the next few years, we remain optimistic for continuing strong capital market volumes on a favorable interest rate outlook and demand-supply dynamics.
Islandwide vacancy of office properties tracked by the URA stood at 10.5% as of end-2019, improving 0.1 ppt from 10.6% in Q3 2019 and 1.5 ppt from 12.0% in Q4 2018. Based on URA statistics, islandwide office net absorption remained strong at 1.67 million sq ft for the full year 2019, compared to 1.85 million sqft in 2018.
We estimate the healthy net absorption in 2018 and 2019 were driven mainly by the technology and flexible workspace sectors.”
Ms Tricia Song, Head of Research for Singapore at Colliers International, commenting on the full year 2019 office rents decline said:
“Based on Colliers’ research, average CBD Premium and Grade A gross effective rents stood at SGD10.09 psf per month in Q4 2019, flat QOQ, slowing down from earlier quarters. Overall, 2019 was a year of two halves: H1 2019 saw a steady 5.4% rental growth on the back of strong net absorption led by the flexible workspace and technology sectors, while H2 2019 witnessed lower net demand from weaker economic growth, rising vacancy and slowing rental momentum as tenants show increasing resistance to rising rents.
In 2020, we expect the demand driver to be the technology sector, which is still growing, while flexible workspace operators could consolidate after building up a significant presence in the past three years. The MAS’ issuance of up to five digital licenses in Singapore should also contribute to net absorption, though impact now is unclear.
Meanwhile, Grade A and Premium CBD office vacancy is expected to continue to trend below the 10-year historical average of 6% until 2022 given tight CBD Grade A office supply of 3% of stock per annum over 2020–2021 versus 6% for the last 10 years.”
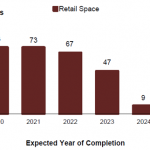
As the full year 2019 office rents decline, prices of retail space increased by 1.8% in 4th Quarter 2019, compared with the increase of 1.1% in the previous quarter.
Rentals of retail space increased by 2.3% in 4th Quarter 2019, following the same increase of 2.3% in the previous quarter. For the whole of 2019, prices of retail space increased by 1.3%, compared with the increase of 0.6% in 2018; while rentals of retail space increased by 2.9%, compared with the decline of 1.0% in 2018.
Supply in the Pipeline
As at the end of 4th Quarter 2019, there was a total supply of 333,000 sq m GFA of retail space from projects in the pipeline, compared with the 288,000 sq m GFA of retail space in the pipeline in the previous quarter.
Stock and Vacancy
The amount of occupied retail space increased by 26,000 sq m (nett) in 4th Quarter 2019, compared with the increase of 29,000 sq m (nett) in the previous quarter. The stock of retail space increased by 29,000 sq m (nett) in 4th Quarter 2019, compared with the increase of 16,000 sq m (nett) in the previous quarter. As the changes in occupied retail space and stock of retail space were similar, the island-wide vacancy rate of retail space remained at 7.5% as at the end of 4th Quarter 2019, same as the end of the previous quarter.
Prices and Rentals of private homes according to 4th Quarter 2019 real estate statistics
Prices of private residential properties increased by 0.5% in 4th Quarter 2019, compared with the 1.3% increase in the previous quarter. For the whole of 2019, prices of private residential properties increased by 2.7%, compared with the 7.9% increase in 2018.
Prices of landed properties increased by 3.6% in 4th Quarter 2019, compared with 1.0% increase in the previous quarter. Prices of non-landed properties decreased by 0.3% in 4th Quarter 2019, compared with the 1.3% increase in the previous quarter. For the whole of 2019, prices of landed properties rose by 5.7% while those of non-landed properties rose by 1.9%.