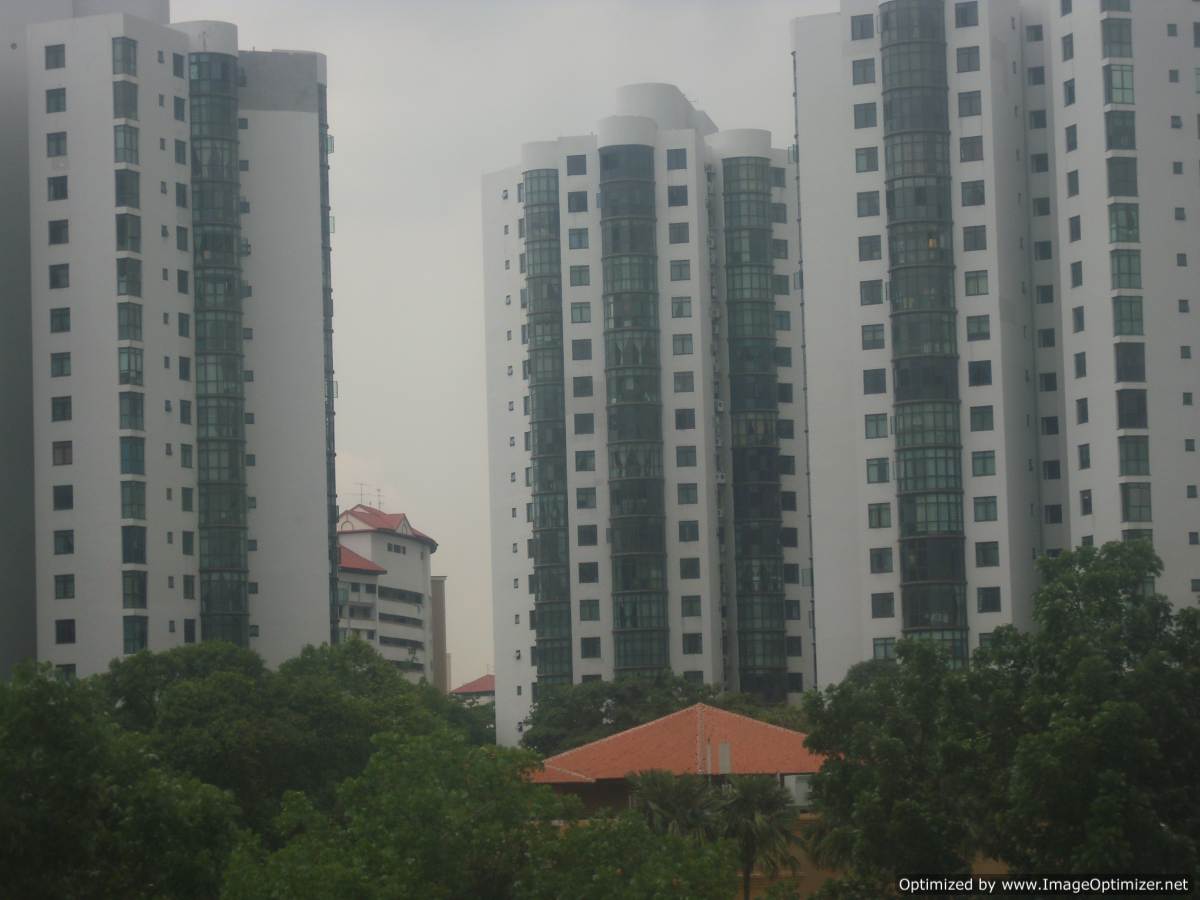
Prices for overall private homes dipped, yet again, in 2nd Quarter 2014 as indicated by the flash estimates of the Urban Redevelopment Authority (URA) price index.
For the latest quarter, the price tumble at 1.09 per cent is smaller than the preceding quarter’s 1.26 per cent. The price index slid from 211.6 in the 1st Quarter to 209.3.
For non-landed private residences, the decline was greatest for the Core Central Region (CCR), followed by the Outside Central Region (OCR) and the Rest of Central Region (RCR) at 1.5, 1.1, and 0.6 per cent, respectively. In the preceding quarter, the dip was 1.1, 0.1 and 3.3 per cent.
For the landed counterparts, prices fell 1.5 per cent over 0.7 per cent in the previous quarter.
While the preliminary figures suggest a tempered private housing market, it remains to be seen if the full real estate statistics, released on the 24th or 25th of this month, will show the same results.
Table 1: URA Price Index And Q-o-Q Change, 3Q 2009 – 2Q 2014
|
Period |
URA Property Price Index: All Private Residential (exclude EC) |
Quarter-on-Quarter Change |
|
2Q2014 |
209.3 (Flash Estimate) |
(1.09) |
|
1Q2014 |
211.6 |
(1.26) |
|
4Q2013 |
214.3 |
(0.92) |
|
3Q2013 |
216.3 |
0.42 |
|
2Q2013 |
215.4 |
1.03 |
|
1Q2013 |
213.2 |
0.57 |
|
4Q2012 |
212 |
1.83 |
|
3Q2012 |
208.2 |
0.63 |
|
2Q2012 |
206.9 |
0.44 |
|
1Q2012 |
206 |
(0.10) |
|
4Q2011 |
206.2 |
0.24 |
|
3Q2011 |
205.7 |
1.33 |
|
2Q2011 |
203 |
1.96 |
|
1Q2011 |
199.1 |
2.21 |
|
4Q2010 |
194.8 |
2.74 |
|
3Q2010 |
189.6 |
2.93 |
|
2Q2010 |
184.2 |
5.26 |
|
1Q2010 |
175 |
5.61 |
|
4Q2009 |
165.7 |
7.39 |
|
3Q2009 |
154.3 |
15.75 |
Source: URA
Capitalise on the cooling market by buying now. Speak to an iCompareLoan mortgage broker. Compare mortgage loan Singapore.
For advice on a new home loan.
For refinancing advice.
Download this article here.


