Q2 2020 office space rental indices of office space in the Central and Fringe Areas paint very different pictures
Q2 2020 office space
Table of Contents
Q2 2020 office space market at a glance:

Q2 2020 office space Prices and Rentals
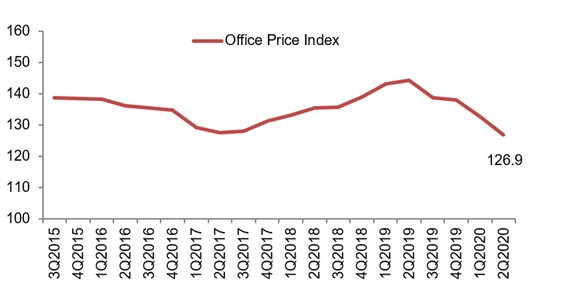
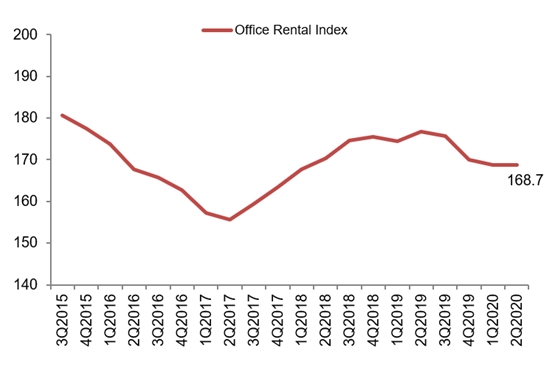
Prices of office space decreased by 4.3% in 2nd Quarter 2020, compared with the 4.0% decrease in the previous quarter. Rentals of office space remained unchanged in 2nd Quarter 2020, compared with the 0.8% decrease in the previous quarter.
Property Price Index of office space in Central Region according to Q2 2020 office space
Rental Index of office space in Central Region according to Q2 2020 office space
Supply in the Pipeline
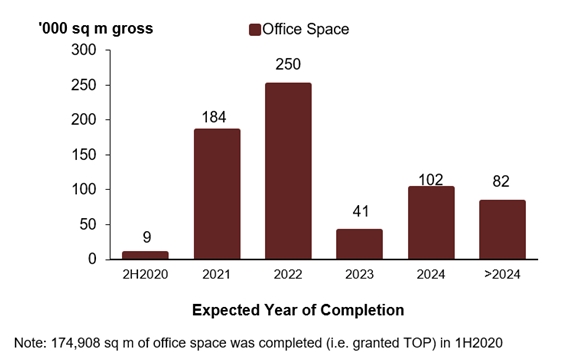
As at the end of 2nd Quarter 2020, there was a total supply of about 668,000 sq m GFA of office space in the pipeline, compared with the 682,000 sq m GFA of office space in the pipeline in the previous quarter.
Pipeline supply of office space
Stock and Vacancy
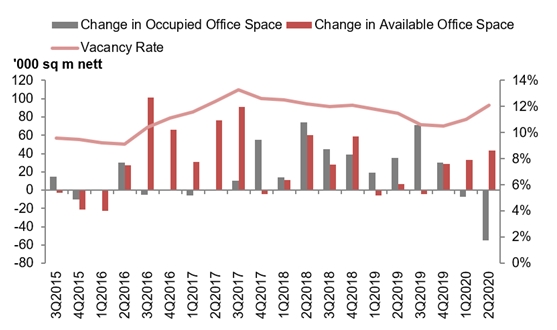
The amount of occupied office space decreased by 55,000 sq m (nett) in 2nd Quarter 2020, compared with the decrease of 7,000 sq m (nett) in the previous quarter. The stock of office space increased by 43,000 sq m (nett) in 2nd Quarter 2020, compared with the increase of 33,000 sq m (nett) in the previous quarter. As a result, the island-wide vacancy rate of office space increased to 12.1% as at the end of 2nd Quarter 2020, from 11.0% as at the end of the previous quarter.
Stock and vacancy of office space
Commenting on the Q2 2020 office space statistics as published by URA, CBRE said:
- “While the rental index of office space may have kept stable in Q2 2020, the rental indices of office space in the Central and Fringe Areas paint very different pictures. The rental index of office space in the Central Area registered a decline of 2.3% q-o-q, while the rental index of office space in the Fringe Area saw an increase of 1.1% q-o-q. This seems to indicate some resilience in the Fringe Area.
- The impact of COVID-19 weighed heavily on Singapore’s economy. Across an array of industries, businesses are tightening their belts and cost containment continues to be a key focus. Leasing activity was primarily driven by renewals or relocations, with more firms downsizing from their current footprint. These could have contributed to the larger decline in occupied space of 55,000 sq m in Q2 2020 compared to -7,000 sq m in Q1 2020.
- This quarter saw a net new supply of 43,000 sq m which stemmed from the completion of two developments in Q2 2020: 79 Robinson Road and a strata-titled building, Centrium Square. Coupled with the negative net absorption, islandwide vacancy rose from 11% in Q1 2020 to 12.1% in Q2 2020.
- Looking forward, vacancy levels are likely to rise; downsizing decisions have brought about a growing volume of secondary space. Coupled with subdued demand, further downward pressure on rents is expected in the second half of 2020.
- With development delays expected, the supply situation over the next four years may be cushioned by such delays, in light of rebalancing the muted demand situation.”
Commenting on the 2nd Quarter 2020 real estate statistics on residential developments, CBRE said:
- “Prices of private residential properties increased by 0.3% in Q2 2020, compared with the 1.0% decrease in Q1 2020. This contrasts with previous flash estimates where the price index would have declined by 1.1% in Q2 2020. This was mainly attributed to a 2.7% increase in prices of non-landed properties in CCR in Q2 2020, as compared to the 2.2% decrease in the previous quarter. According to caveats, the increase of the index could be attributed to the resale transactions.
- In addition, the trend was driven by the resilient nature of landed segment and non-landed properties in the OCR where prices remained relatively unchanged in Q2 2020.
- Launch activities took a backseat with disruptions from the COVID-19 pandemic as show flats were mandated to close during the “circuit breaker” period. Developers launched 1,852 units in Q2 2020, compared with 2,093 units in the previous quarter.
- Despite that, new home sales managed to clock in at 1,713 units (excluding ECs), a sign that buyers are still actively looking for opportunities in the market. Sales may be driven by some developers offering discounts and incentives. The low interest rate environment has also motivated buyers.
- Following the lifting of “circuit breaker” measures, developers are likely to resume launch activity and we could see some pent-up demand in H2 2020. Moving forward, developers could be more flexible in their pricing expectations, as the bunching up of projects may lead to some price competition among developers.
- Year to date, prices have fallen by 0.65% in H1 2020. CBRE Research believes that H2 2020 will see larger price corrections amid softer economic sentiments and the residential property price index could correct by up to 5% for the whole of 2020.”
The 2nd Quarter 2020 real estate statistics showed that prices of private residential properties increased by 0.3% in 2nd Quarter 2020, compared with the 1.0% decrease in the previous quarter.
Prices of landed properties remained unchanged in 2nd Quarter 2020 real estate statistics, compared with the 0.9% decrease in the previous quarter. Prices of non-landed properties increased by 0.4% in 2nd Quarter 2020, compared with the 1.0% decrease in the previous quarter.
Prices of non-landed properties in Core Central Region (CCR) increased by 2.7% in 2nd Quarter 2020, compared with the 2.2% decrease in the previous quarter. Prices of non-landed properties in Rest of Central Region (RCR) decreased by 1.7%, compared with the 0.5% decrease in the previous quarter. Prices of non-landed properties in Outside Central Region (OCR) increased by 0.1%, compared with the 0.4% decrease in the previous quarter.
Rentals of private residential properties decreased by 1.2% in 2nd Quarter 2020 real estate statistics, compared with the 1.1% increase in the previous quarter.