The Urban Redevelopment Authority (URA) on July 24th released the 2nd Quarter 2020 real estate statistics.
PRIVATE RESIDENTIAL PROPERTIES
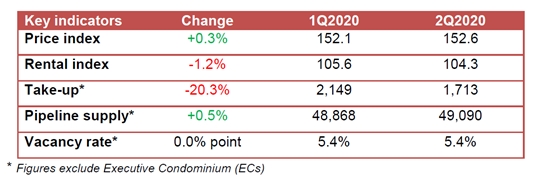
Private residential market according to 2nd Quarter 2020 real estate statistics at a glance:
Prices and Rentals
The 2nd Quarter 2020 real estate statistics showed that prices of private residential properties increased by 0.3% in 2nd Quarter 2020, compared with the 1.0% decrease in the previous quarter.
Property Price Index of private residential properties

Prices of landed properties remained unchanged in 2nd Quarter 2020 real estate statistics, compared with the 0.9% decrease in the previous quarter. Prices of non-landed properties increased by 0.4% in 2nd Quarter 2020, compared with the 1.0% decrease in the previous quarter.
Prices of non-landed properties in Core Central Region (CCR) increased by 2.7% in 2nd Quarter 2020, compared with the 2.2% decrease in the previous quarter. Prices of non-landed properties in Rest of Central Region (RCR) decreased by 1.7%, compared with the 0.5% decrease in the previous quarter. Prices of non-landed properties in Outside Central Region (OCR) increased by 0.1%, compared with the 0.4% decrease in the previous quarter.
Rentals of private residential properties decreased by 1.2% in 2nd Quarter 2020 real estate statistics, compared with the 1.1% increase in the previous quarter.
Rental Index of private residential properties
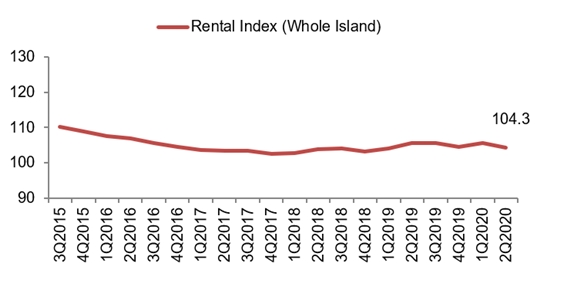
Rentals of landed properties decreased by 2.3% in 2nd Quarter 2020, compared with the 0.9% decrease in the previous quarter. Rentals of non-landed properties decreased by 1.1%, compared with the 1.3% increase in the previous quarter.
Rentals of non-landed properties in CCR decreased by 0.6%, compared with the 1.4% increase in the previous quarter. Rentals in RCR decreased by 1.9%, compared with the 0.6% increase in the previous quarter. Rentals in OCR decreased by 0.9%, compared with the 1.9% increase in the previous quarter.
Launches and Take-up
Developers launched 1,852 uncompleted private residential units (excluding ECs) for sale in 2nd Quarter 2020, compared with 2,093 units in the previous quarter. Developers sold 1,713 private residential units (excluding ECs) in 2nd Quarter 2020, compared with the 2,149 units sold in the previous quarter. Number of private housing units launched and sold by developers (excluding ECs).

Developers did not launch any EC units for sale in 2nd Quarter 2020, and sold 71 EC units in the quarter. In comparison, developers launched 1,044 EC units and sold 590 EC units in the previous quarter.
Resales and Sub-sales
There were 933 resale transactions in 2nd Quarter 2020, compared with the 2,080 units transacted in the previous quarter. Resale transactions accounted for 35.0% of all sale transactions in 2nd Quarter 2020, compared with 48.7% in the previous quarter.
There were 18 sub-sale transactions in 2nd Quarter 2020, compared with the 40 units transacted in the previous quarter. Sub-sales accounted for 0.7% of all sale transactions in 2nd Quarter 2020, compared with 0.9% in the previous quarter.
Number of resale and sub-sale transactions for private residential units (excluding ECs)

Supply in the Pipeline
As at the end of 2nd Quarter 2020, there was a total supply of 49,090 uncompleted private residential units (excluding ECs) in the pipeline with planning approvals3, compared with the 48,868 units in the previous quarter. Of this number, 27,977 units remained unsold as at the end of 2nd Quarter 2020, compared with the 29,149 units in the previous quarter.
After adding the supply of 3,613 EC units in the pipeline, there were 52,703 units in the pipeline with planning approvals. Of the EC units in the pipeline, 1,899 units remained unsold. In total, 29,876 units with planning approvals (including ECs) remained unsold, down from 31,099 units in the previous quarter.
Total number of unsold private residential units in the pipeline

Based on the expected completion dates reported by developers, 2,087 units (including ECs) are expected be completed in the remaining 2 quarters of 2020. Another 12,932 units (including ECs) are expected to be completed in 2021.
Pipeline supply of private residential units and ECs (with planning approvals) by expected year of completion

Apart from the 29,876 unsold units (including ECs) with planning approval as at the end of 2nd Quarter 2020, there is a potential supply of around 5,400 units (including ECs) from Government Land Sales (GLS) sites that have not been granted planning approval yet.
Stock and Vacancy
The stock of completed private residential units (excluding ECs) decreased by 173 units in 2nd Quarter 2020, compared with the increase of 1,364 units in the previous quarter. The stock of occupied private residential units (excluding ECs) decreased by 13 units in 2nd Quarter 2020, compared with the increase of 1,521 units in the previous quarter. As a result, the vacancy rate of completed private residential units (excluding ECs) remained unchanged at 5.4% as at the end of 2nd Quarter 2020.
Stock and vacancy of private residential units (excluding ECs)

Vacancy rates of completed private residential properties as at the end of 2nd Quarter 2020 in CCR, RCR and OCR were 7.5%, 6.1% and 4.0% respectively, compared with the 7.4%, 6.2% and 4.1% in the previous quarter.
Commenting on the 2nd Quarter 2020 real estate statistics on residential developments, CBRE said:
- “Prices of private residential properties increased by 0.3% in Q2 2020, compared with the 1.0% decrease in Q1 2020. This contrasts with previous flash estimates where the price index would have declined by 1.1% in Q2 2020. This was mainly attributed to a 2.7% increase in prices of non-landed properties in CCR in Q2 2020, as compared to the 2.2% decrease in the previous quarter. According to caveats, the increase of the index could be attributed to the resale transactions.
- In addition, the trend was driven by the resilient nature of landed segment and non-landed properties in the OCR where prices remained relatively unchanged in Q2 2020.
- Launch activities took a backseat with disruptions from the COVID-19 pandemic as show flats were mandated to close during the “circuit breaker” period. Developers launched 1,852 units in Q2 2020, compared with 2,093 units in the previous quarter.
- Despite that, new home sales managed to clock in at 1,713 units (excluding ECs), a sign that buyers are still actively looking for opportunities in the market. Sales may be driven by some developers offering discounts and incentives. The low interest rate environment has also motivated buyers.
- Following the lifting of “circuit breaker” measures, developers are likely to resume launch activity and we could see some pent-up demand in H2 2020. Moving forward, developers could be more flexible in their pricing expectations, as the bunching up of projects may lead to some price competition among developers.
- Year to date, prices have fallen by 0.65% in H1 2020. CBRE Research believes that H2 2020 will see larger price corrections amid softer economic sentiments and the residential property price index could correct by up to 5% for the whole of 2020.”