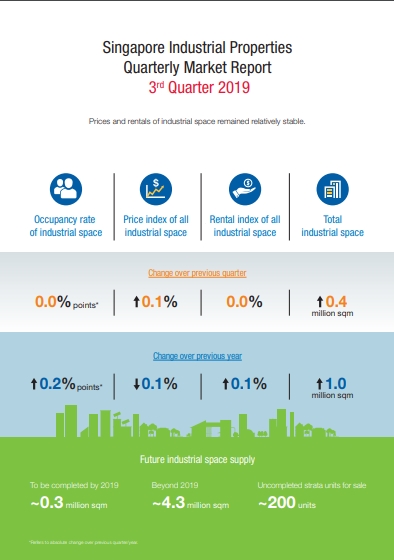
According to the JTC industrial property statistics, rents and prices of industrial space in Singapore remained stable for the third quarter (3Q 2019). The JTC industrial property statistics showed that in 3Q 2019, the occupancy rate of the overall industrial property market remained unchanged at 89.3%. Prices and rentals of industrial spaces remained stable.
With the release of the JTC industrial property statistics, the statutory board said that it will continue to monitor the market closely to ensure a stable and sustainable supply of land and space to support the needs of industrialists. JTC added that moving forward, it will continue to develop new industrial facilities and estates that will meet the needs of industrialists, support their transformation and upgrading, and enhance their productivity and competitiveness.
Commenting on the JTC industrial property statistics, Colliers International said that it signals the stabilisation in the industrial market, but that outlook remains soft.
“Both rents and occupancy rates of the overall industrial property market remained unchanged quarter-on-quarter (QOQ) in the third quarter of 2019, as Singapore’s industrial market continues to navigate the global economic headwinds. Meanwhile, prices of industrial properties saw minor improvements in Q3 2019.
Although the Q3 data showed some signs of stabilisation, we are cautious about the outlook of the industrial market, particularly the warehouse and factory segments. We maintain our forecast that overall rents and occupancy should remain weak in the next few quarters.
Rents and occupancy rate
After the first increment in 17 quarters in Q2 2019, the All-Industrial rental index returned to stable level, remaining unchanged QOQ in Q3 2019. This put the All-Industrial rental index at 13.6% below the peak in Q2 2014.Similarly, overall occupancy rate remained at 89.3% for the fourth consecutive quarter. This is the same level from Q4 2018 and the highest since Q1 2017.
Factory
Rents for multiple-user factory stabilised after the marginal uptick in Q2, remaining unchanged QOQ in Q3 with occupancy rate declining by 0.1 pp QOQ to 87.1%.Meanwhile, single-user factory continued to see the highest rental growth among all segments in Q3, at 0.5% QOQ and 1.0% year-on-year (YOY). Occupancy level also improved by 0.2 pp QOQ to 91.1% on robust new demand totaling almost 3 million sq ft (net) during Q3.
Business Park
Business park rents maintained the upward trajectory for the third consecutive quarter, albeit at a slower pace of 0.1% QOQ, compared to 0.9% and 0.2% in Q1 and Q2 this year, respectively. Overall occupancy in business park space also improved by 0.2 pp QOQ to 86.2%, led by International Business Park which saw a 1.6 pp increase to 71.4%.Warehouse
Warehouse space saw both rents and occupancy decline in Q3 as the deterioration in global trade continued to dampen logistics demand. Warehouse rents dropped by another 0.2% QOQ and occupancy dropped by 0.6 pp QOQ as supply almost quadrupled demand to 1.2 million sq ft (net).Prices
The All-Industrial price index saw marginal improvement of 0.1% QOQ in Q3 2019, led by single-user factory which increased by 0.3% QOQ. The price index for multiple-user factory stabilised, remaining unchanged QOQ after three consecutive quarters of decline.We note the uptick in prices for centralised factories and those with long land tenures of 30 years and above. Prices at multiple-user factory in central region rose 0.5% QOQ. Those with more than 60 years remaining tenure rose 0.7% QOQ while factories with less than 30 years land tenure saw a price drop of 1.5% QOQ, reflecting the preference for properties with longer remaining leases.
Future supply
The total industrial stock completed in Q3 2019 stood at 3.8 million sq ft (net). This brought total new supply in the first nine months of 2019 to 9.3 million sq ft (net), of which more than 61% are single-user factory spaces.JTC expects another 3.6 million sq ft (gross) of industrial space, 73% of which are single-user factories, to come on-stream in the last quarter of 2019. Assuming 80-90% efficiency for the future upcoming supply, we expect the total industrial space completed in 2019 to be around 12.5 million sq ft (net), more than twice the 5.84 million sq ft of net new completion in 2018.
New supply across all industrial types is set to further intensify in 2020 to 20.6 million sq ft (gross), led by multiple-user factory segment (45% of total supply), before tapering off from 2021 onwards.
Macro environment
Based on advance estimates from the Ministry of Trade and Industry (MTI), Singapore’s GDP grew by only 0.1% year-on-year (YOY) in Q3 2019, the same pace as in Q2 and the lowest in a decade, weighed down by the manufacturing sector which continued to shrink for the third straight quarter.Despite having narrowly avoided a technical recession, the outlook for Singapore’s economy remains weak. As of 23 October 2019, both Oxford Economics and the International Monetary Fund (IMF) have downgraded Singapore’s GDP growth forecast for 2019 to 0.5% – from 0.7% and 2.0%, respectively – due to persistent export headwinds surrounding the US-China trade tensions, and the downturn in electronics. Oxford Economics forecasts Singapore’s GDP to grow by 1.5% in 2020 while IMF projects a more subdued level at 1.0%, given the country’s dependence on external trade.”
Commenting on the outlook for the sector based on the JTC industrial property statistics, Ms Tricia Song, Colliers International’s Head of Research for Singapore, said:
“The outlook for the manufacturing sector remained soft, given the challenging external environment and sluggish export volumes. On 10th October 2019, British technology company Dyson announced the closure of its automotive division, including its plan for the first electric car plant in Singapore. With new supply of factory space between Q4 2019 and end 2020 expected to be around 17 million sq ft (net, equivalent to about 4% of current factory stock), we maintain our forecast that rents in this segment will likely remain under pressure in the next few quarters.
Meanwhile, new business park and high-spec spaces should continue to benefit from the lack of premium stock and tight upcoming supply, resulting in healthy demand in Q4 2019. Coupled with the spillover effect from sharp office rental growth, we forecast the current rental gap between business park and general factory space to continue into 2020.
We expect warehouse supply to ease, with annual expansion averaging 1.6% of warehouse total stock over 2019-2023 versus 7.6% for the previous four years over 2014-2018. With elevated vacancy rate of 11.9% as of Q3 2019, and the subdued economy, we forecast logistics rent to remain soft, declining marginally by 1.5% and 1.0% YOY in 2020 and 2021 respectively, before recovering after 2022 as the overall industrial sector bottoms out.
We recently released a report “The Future of Logistics Real Estate” where we identified the top logistics micro-market locations in Singapore, market outlook and recommendations for occupiers, landlords and investors.”